Case Study — 2026
FASHION
HERO
A competitor dropped its commission to zero. Cutting ours was not the answer.
Built during AI Product Heroes 2, a six-week cohort-based program for product builders. FashionHero does not exist: the company and its numbers are fictional, written for the course. The method and the conclusions are not. FashionHero is a fast-growing fashion marketplace (+28% YoY revenue, 2.4M active buyers, 4,200 sellers) with one structural risk: 100% of revenue comes from transaction commission. When a competitor ("Forte") launched a 0% commission campaign aimed directly at FashionHero's most valuable sellers, I took on the response: seller segmentation and interviews, picking the one problem worth solving, then an A/B test design and a working prototype.
Roles
- Product Strategy
- Data Analysis
- Prototype Development
Timeline
Capstone Project AI Product Heroes 2 — June 2026
Live
Visit Website →Tech Stack
- Claude Code
- Vite + React 18
- TypeScript
- Tailwind + shadcn/ui
- PostHog
- Vercel
Simulated seller P&L data
Every złoty FashionHero earns is commission. There is no second source. A competitor launched a 0% commission offer aimed at "backbone" sellers (10+ reviews, 3+ months active) — a segment that generates 2.6x higher margin per PLN of GMV than top sellers, and does not know it. If they leave, they take buyers with them who will not come back. There are 6–9 months to react: as long as it takes the competitor to build a buyer base of its own.
I designed a Retention Campaign — 50 free Promoted Listings credits for at-risk sellers, paired with a real-time ROI dashboard showing sales impact within days. The approach was validated through an Opportunity Solution Tree, scored against 3 other directions using a PRES framework (Pain/Reach/Evidence/Strategic fit), and I wrote a 6-week A/B test to verify it (200 test vs. 200 control sellers).
A working prototype instrumented with PostHog, and a test ready to run but never run — the company is a study case, so there are no results and there will not be any. What remains is how I got there: four course corrections, each forced by something I checked rather than by a change of instinct. Two things I ruled out deliberately and wrote down as such: cutting commission in response to Forte, because that is a race to the bottom won by whoever holds more cash, and selling ad space to outside brands, because it monetises the seller's traffic instead of helping them sell.
The interesting part of this project is not how it looks, but why it looks the way it does. Five weeks and four moments where I changed my mind — every time because I had checked something, not because my instinct had shifted.
The Starting Point
I started with twelve revenue hypotheses generated from the brief alone, and wrote one of them up in full: FashionHero Pro, a 199 PLN/month subscription with twenty promotion credits, an analytics dashboard and priority support, aimed at roughly 2,900 sellers who met the entry criteria. Alongside it, three first-year financial scenarios, six risks with mitigations, and a four-phase roadmap. The strongest argument I made at that point was about valuation: recurring revenue is valued at 6–10x annual subscription value, transactional revenue at 2–4x revenue, so the same złoty is worth nearly three times more if it arrives on a cycle. All of it was built without a single number from the platform.
01 — The data killed the segment I was designing for
An analysis of five hundred sellers showed that commission is not a continuous variable here but a label for one of two tiers: a standard rate around 22% and a negotiated one around 15%, with an empty band between them and a hard floor at 14% where 34 sellers had got stuck. The correlation between GMV — the total value of sales passing through the platform — and commission was −0.63, but that is an artefact of the binary structure: within each tier it is effectively zero. Commission itself explained 2.4% of the variance in profit (R², the share of variance a given factor accounts for); GMV explained 21.6%, and the third strongest predictor turned out to be the negative weight of support-ticket volume — the real operational cost of difficult sellers. The top twenty by GMV and the top twenty by margin overlapped in only five cases: the first group sits on the negotiated rate 85% of the time and leaves an average of 1,632 PLN of margin a month, the second sits on the standard rate 90% of the time and leaves 4,205 PLN — 2.6x more on lower GMV. On top of that, 695,000 PLN a month was flowing out to Google and Meta — 58% of the platform's revenue — with no correlation to margin. What surprised me most was the churn paradox: the sellers who had left had higher GMV and higher margin than the ones who stayed. The problem was not acquisition, it was delivering value to the large sellers.
02 — Interviews moved the barrier from price to trust
Three in-depth interviews, one per segment: a large seller on the negotiated rate, a mid-sized one paying full rate, and a new one about to churn. The first two had already tried promotion tools and given up — not over price, but because they could not see whether it had done anything; the third had never tried, afraid of sinking the budget. I built an Opportunity Solution Tree from this — a map connecting the business goal to observed problems and the ideas that address them — in which the opportunity "darkness before the spend" scored a maximum 20 points on PRES: pain, reach, evidence and strategic fit. The test I chose assumed a seller would click "Promote this product" once they could see a specific product, a specific duration and a specific price, with no promises about sales. I rejected six others, including a campaign ROI forecast, because predicting "8–14 orders" is a promise you cannot keep and the first underperforming campaign costs you trust. The 199 PLN product shrank to a single button, built as a fake door — a working interface with no working feature behind it, there purely to measure interest — with an explicit list of what I was not building.
03 — Black Swan and the ADJUST call
In week four, Forte announced 0% commission across the whole category for seven months and emailed FashionHero's sellers directly. I ran the concept through three questions: does it create value that zero commission cannot copy, will the primary metric survive churn, and does the hypothesis still hold. The answers: zero commission lowers the cost of selling, while promotion gives control over visibility — different categories of value — and a seller who leaves abandons a review history the competitor cannot reproduce for 12–18 months. The sample shrinks, but those who stay are more motivated; the hypothesis only breaks for the undecided. I chose ADJUST rather than killing the concept or doubling down: the target user moved from "FashionHero seller" to "seller with history considering migration", the hypothesis moved from "will they pay for visibility" to "will free credits and visible results keep them", and the timeline was pulled forward, because the window closes with every week of migration. I updated the tree with a scenario its first version had not accounted for at all.
04 — A pre-mortem overturned my own test
The first version of the A/B test measured retention as at least one transaction, across 200 test and 200 control sellers over six weeks, with an early stop rule if adoption fell below 10% by week four. Before launching it I ran a pre-mortem — I assumed the test had failed and worked backwards to the reasons. Three came out, and the first was disqualifying: a seller can keep the account, make one token transaction and move 90% of their GMV to the competitor, and this test would count that as success. So I changed the primary metric to GMV per seller, added a churn risk signal as a sampling criterion — a GMV drop of at least 20% over the last 30 days — because the previous criterion selected stable sellers, the ones who would have stayed anyway. I extended the test to 10–12 weeks with an intent survey in week three, because a migration decision takes two to three months to mature. The success thresholds for the prototype were fixed in advance, before any data came in: above 30% of modal opens converting to a launched campaign means continue, 15–29% means iterate, below 15% means drop the concept.
Real-Time ROI Dashboard
Sellers see their campaign effectiveness — "+227% this month" — plus a live sales chart, before spending a single credit.
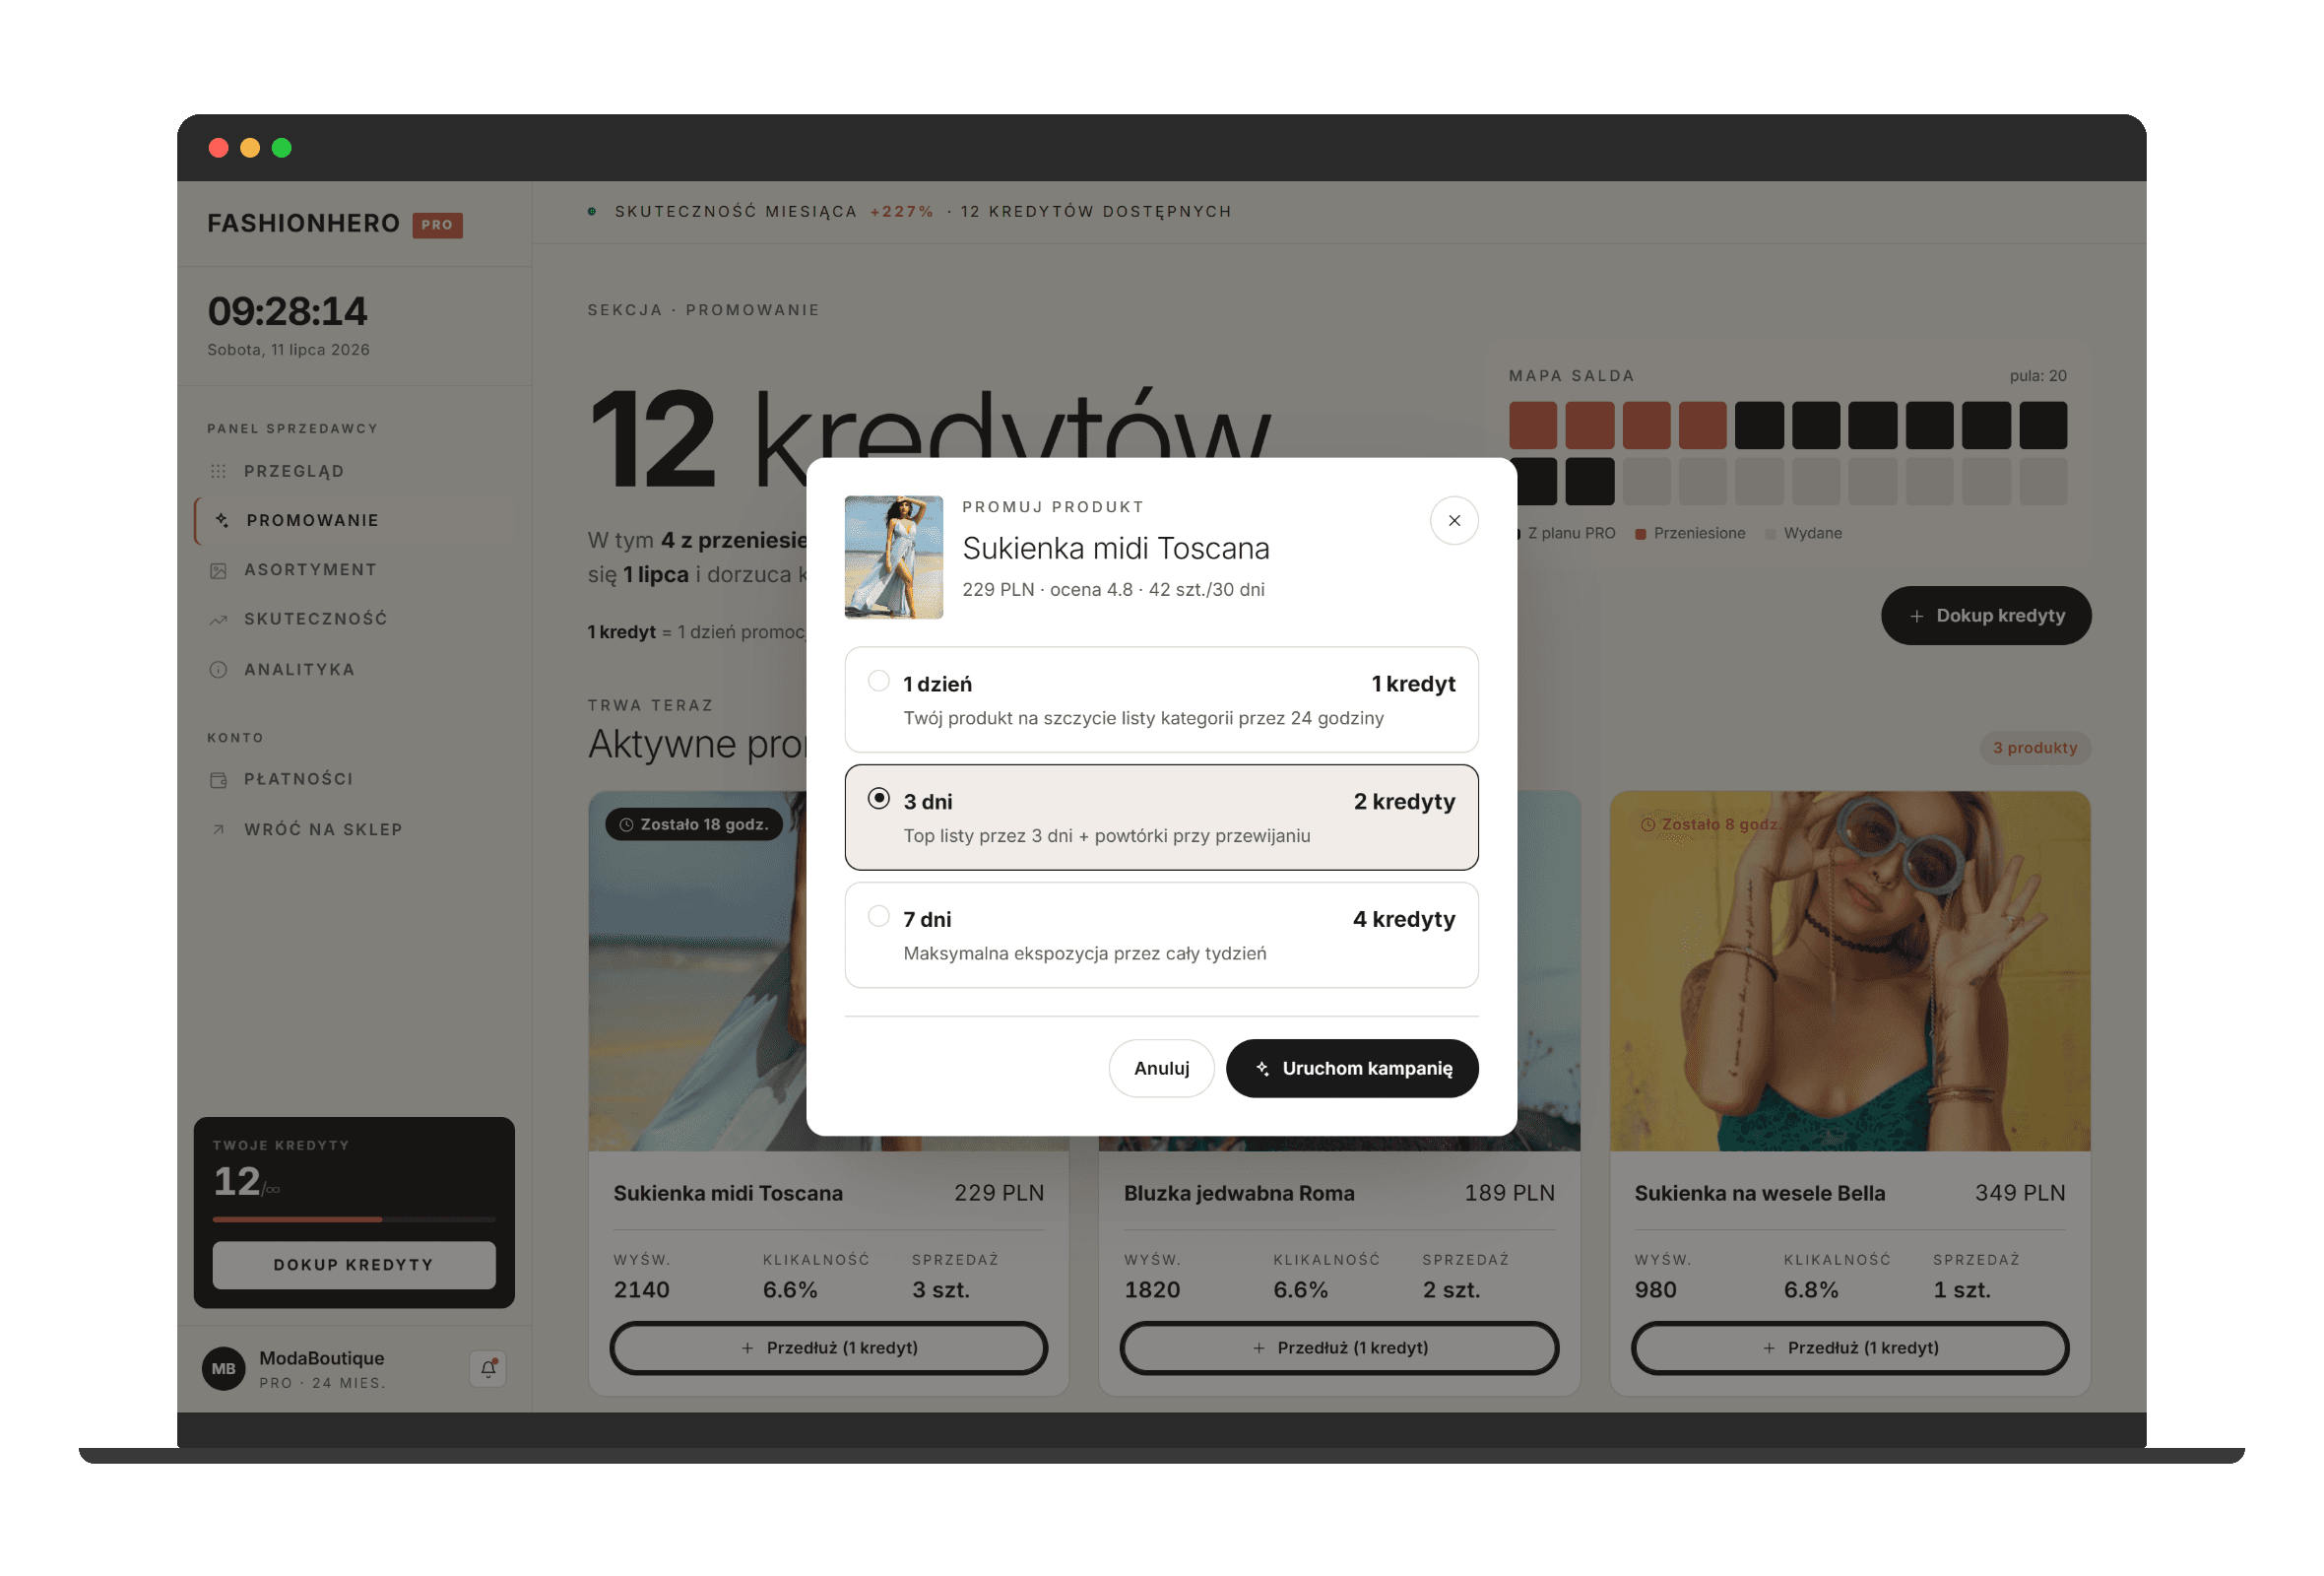
One-Click Promote Flow
A 3-click campaign launch with 1/3/7-day credit tiers, tracking live impressions, clicks, and sales as they happen.
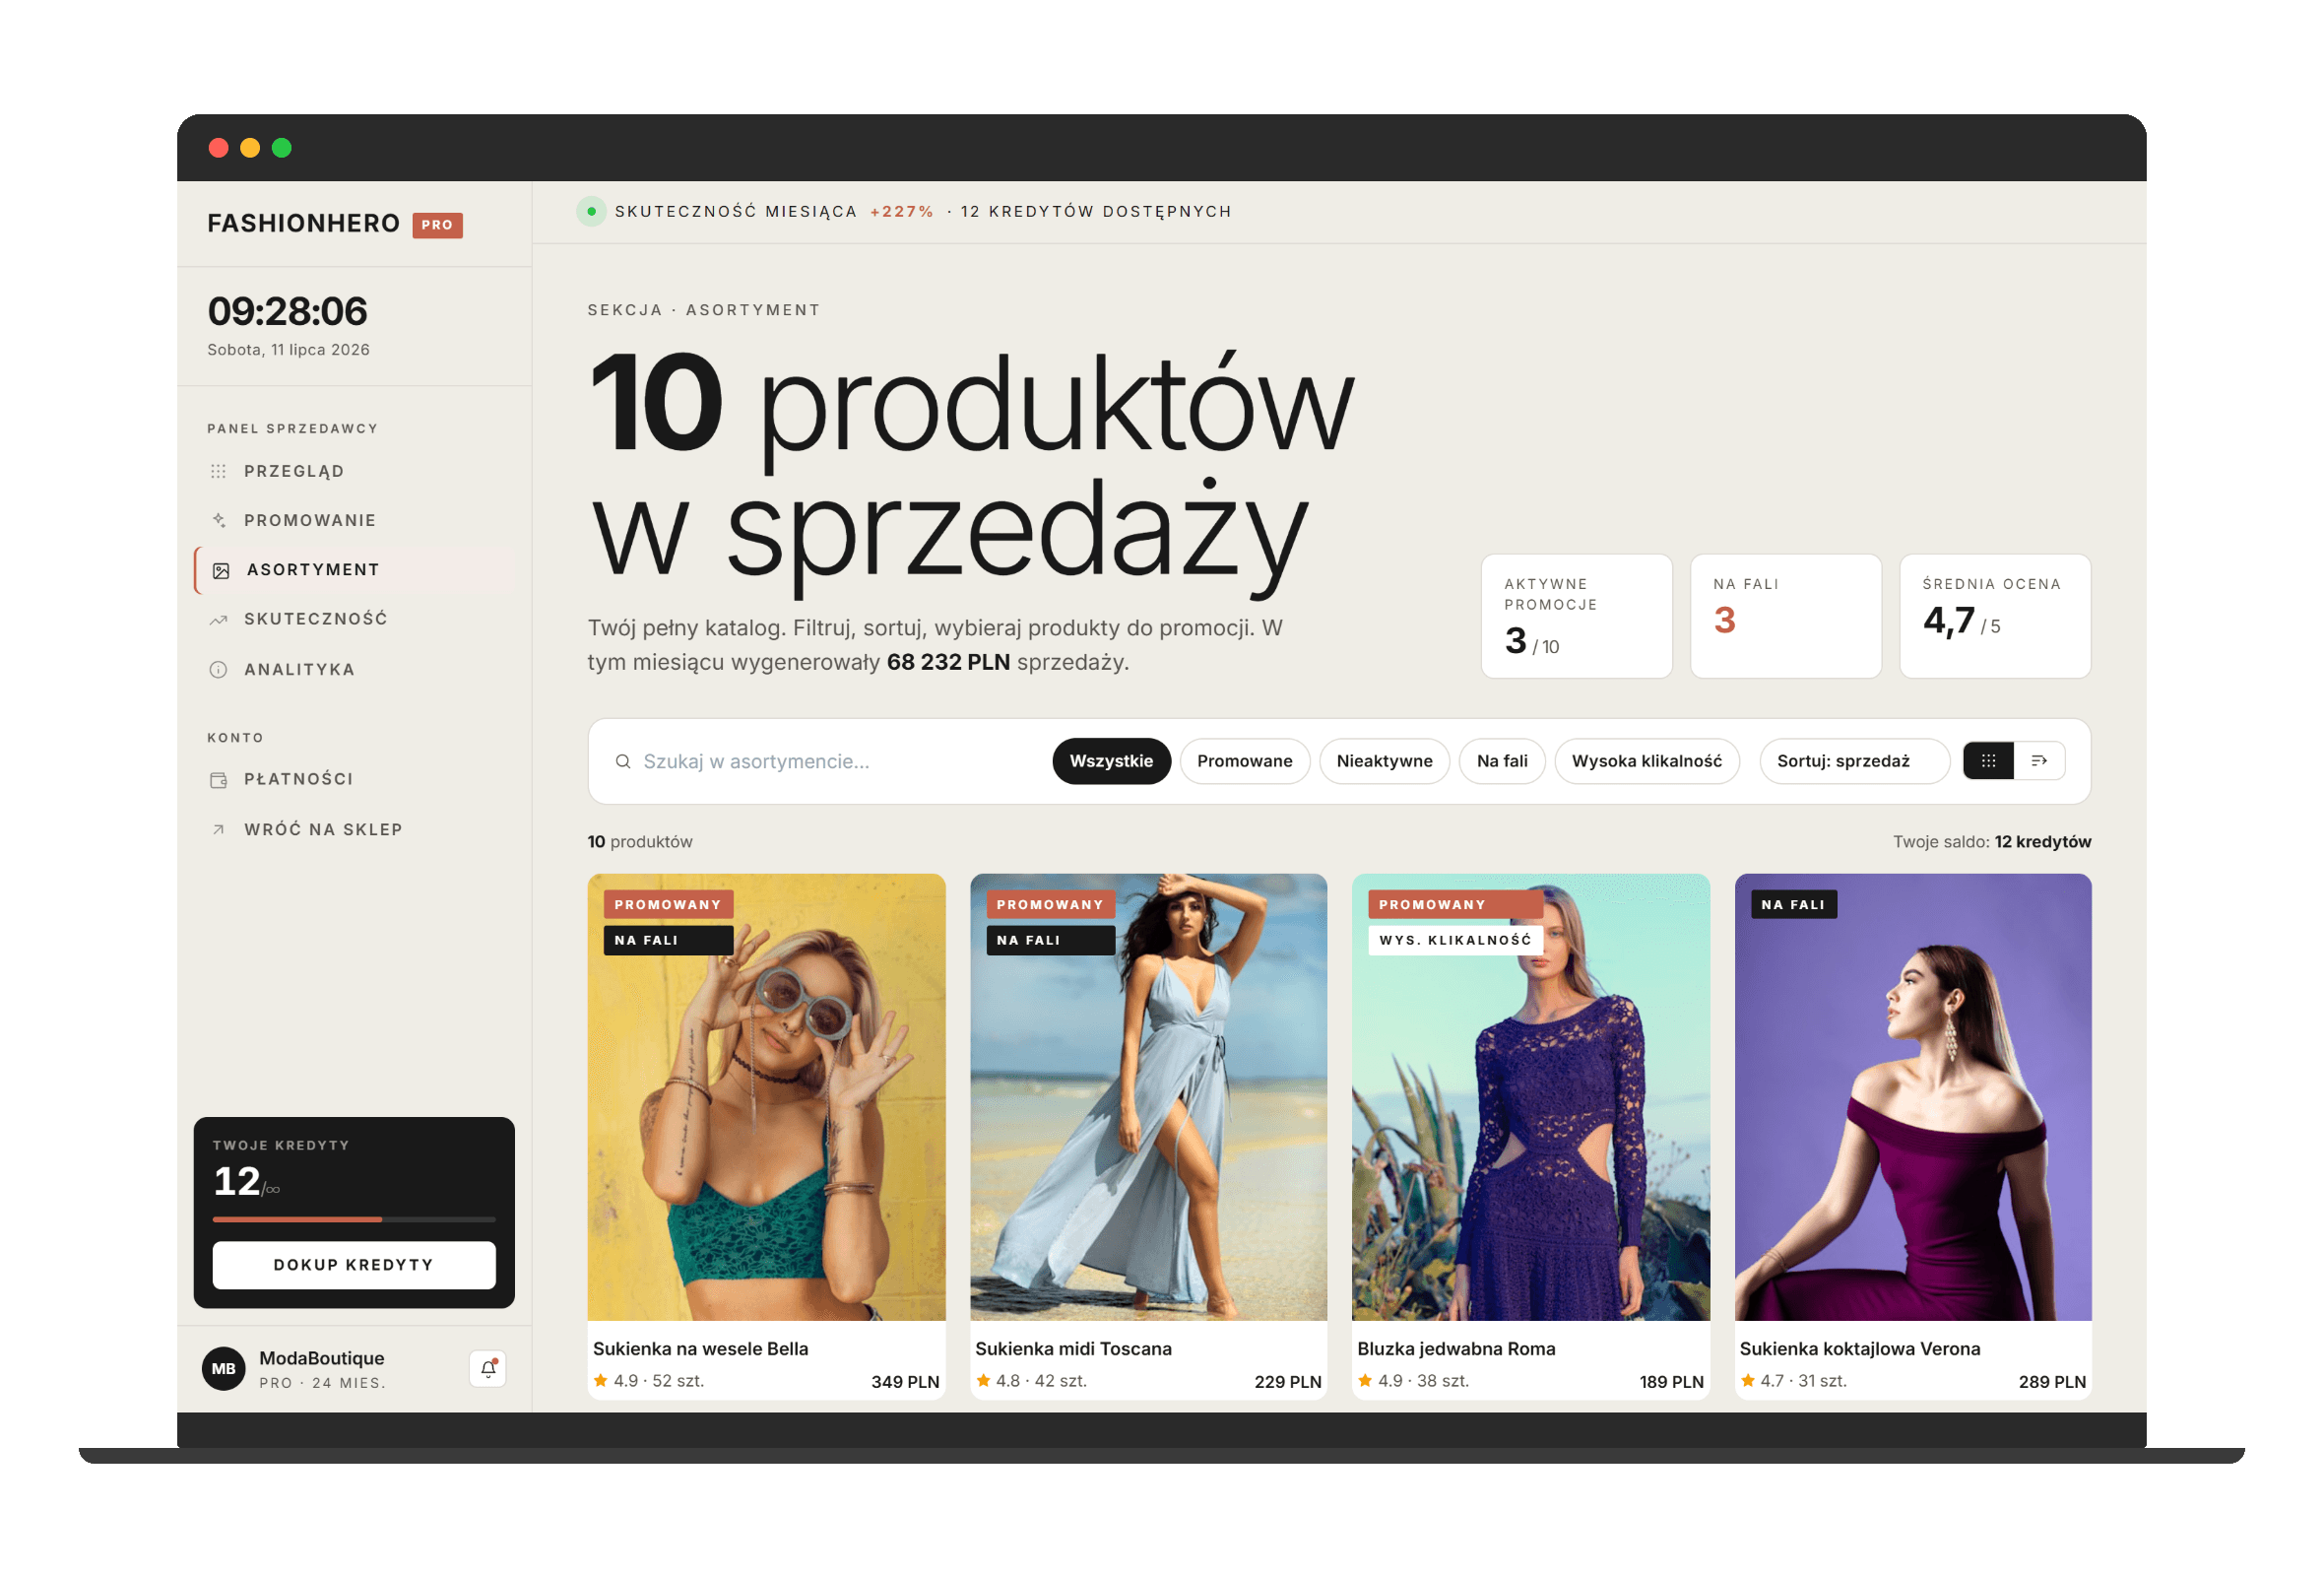
Smart Product Catalog
Tags surface "trending" and "promoted" products against a baseline sales snapshot, so sellers know exactly what to promote next.
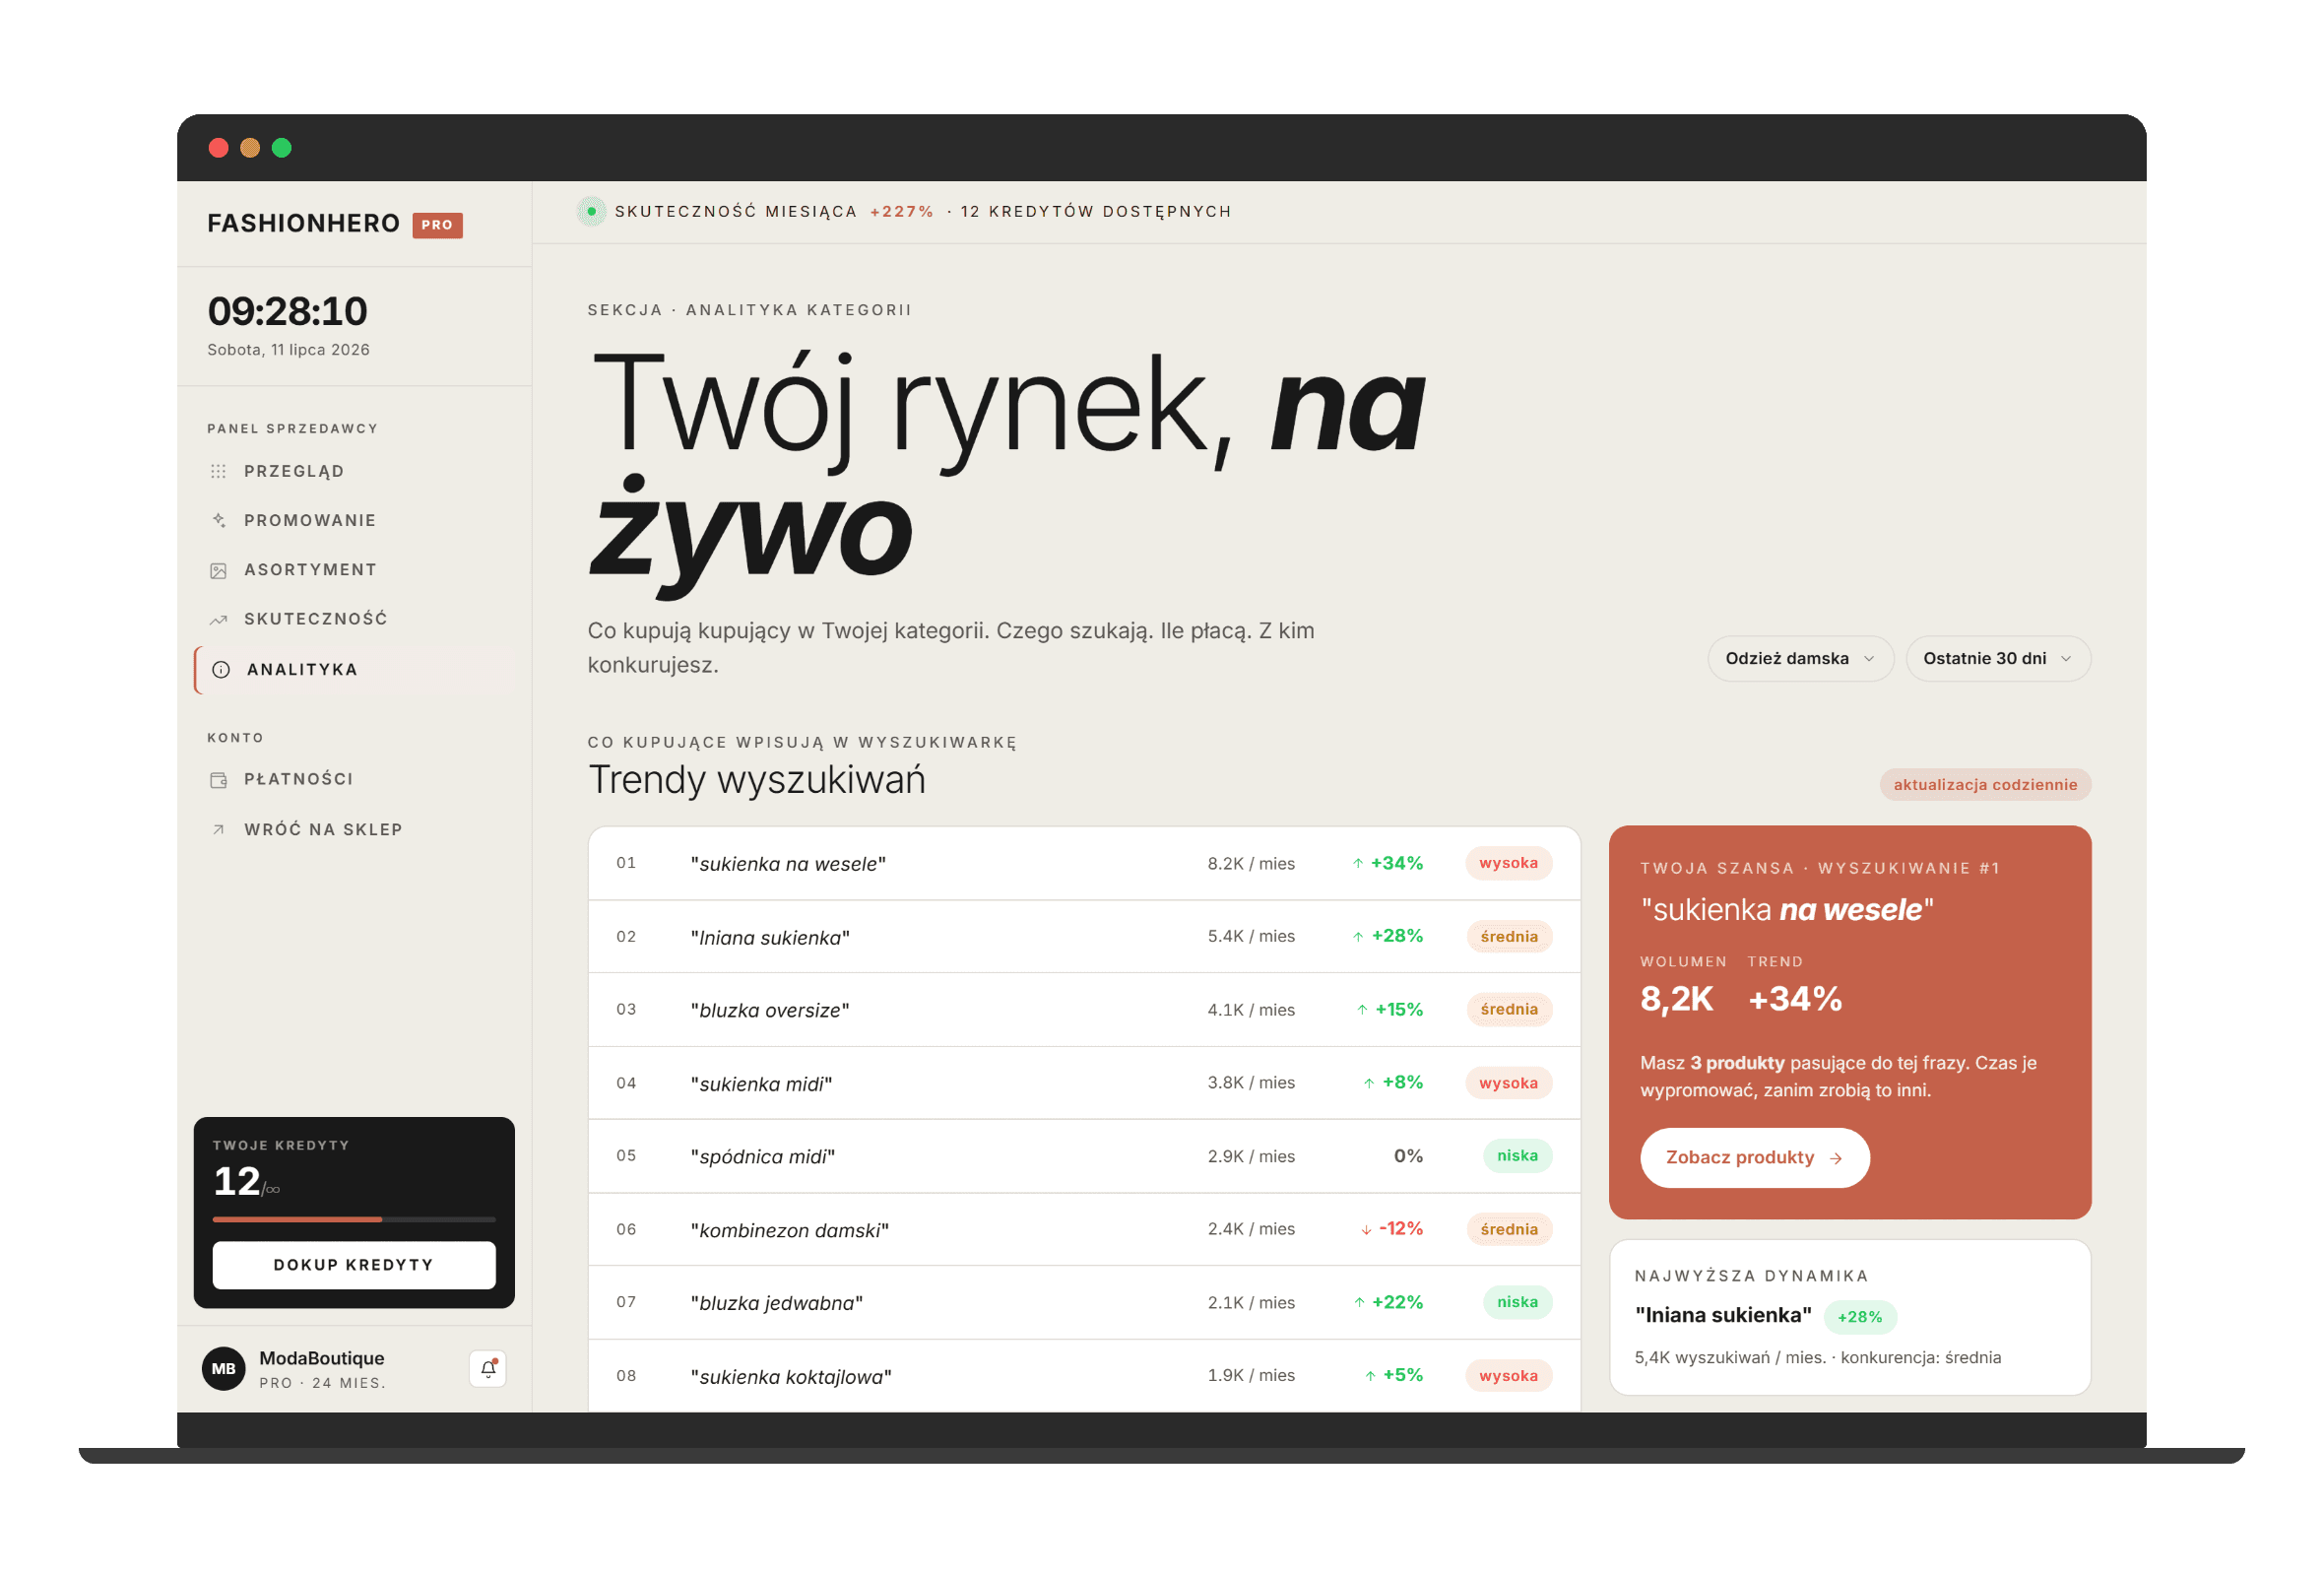
Market & Trend Analytics
Sellers see what people are searching for, and how their own prices sit against the category median.